Don’t Buy the Dips .. yet

Stocks: Why “Buying the Dip” is Fraught with Danger
Take a look at “a dip buyer’s nightmare”

By Elliott Wave International

Investors know that the main U.S. stock indexes have tumbled very quickly.

On a historical basis, some may not realize just how quickly.

A March 23 Marketwatch headline referred to a “mind-bending stat”:

The S&P 500 has dropped 30% from peak to trough faster than any other time in history. The next three fastest were all nasty pullbacks during the Great Depression era. Yes, just 22 days for this stock market to get cut by a third.

This historically swift downturn has prompted a “buy the dip” mentality.

On March 23, a prominent founder of a financial firm told CNBC:

“I’m nibbling right now, for what it is worth.”

Other professional investors have also mentioned that they were doing a little nibbling of their own.

The sentiment expressed was that the market may have a little more downside to go, but that’s about it.

These professionals might turn out to be correct in their judgments of the market. Then again, just because stocks have fallen far and fast – doesn’t mean they can’t fall way farther.

As a historical lesson, let’s take you back 19 years, when our April 2001 Elliott Wave Financial Forecast showed this chart and said:

“If there were ever a testament to the importance of market timing, the NASDAQ over the last year is it. Anyone who bought into the euphoria at the all-time high or the bull trap highs of early September and late January, would have taken successive hits of 40%, 47% and 38%. You can bet that many people followed the “buy” advice in the media on every bounce, losing even more than the “hold-only” loss of 65% from top to bottom.”

Bear in mind, the NASDAQ continued to fall into October 2002, handing even deeper losses to investors who continued to buy on the way down.

Returning to 2020, only time will tell when the bear market has bottomed, if it hasn’t already done so.

Yet, one thing’s for sure even now: The Elliott wave model is offering its own clues about what’s next for the main stock indexes.

See for yourself – 100% free.

You see, Elliott Wave International has just made available our entire “Stocks” section of our monthly Elliott Wave Financial Forecast to Club EWI members. Joining Club EWI is also free.

Elliott Wave International has been guiding investors through bull and bear markets since 1979. From that long experience, EWI’s analysts know that at certain market junctures, they can help the most by giving everyone their latest analysis free.

Now is one of those market junctures.

Read the Financial Forecast excerpt now, free.

This will help you understand how the markets got to this juncture — and, more importantly what’s likely next.

Also, please feel free to share this special excerpt with friends and family.

Again, simply follow this link:

Read the Financial Forecast excerpt now, free.

This article was syndicated by Elliott Wave International and was originally published under the headline Stocks: Why “Buying the Dip” is Fraught with Danger. EWI is the world’s largest market forecasting firm. Its staff of full-time analysts led by Chartered Market Technician Robert Prechter provides 24-hour-a-day market analysis to institutional and private investors around the world.

This article was syndicated by Elliott Wave International and was originally published under the headline Stocks: Why “Buying the Dip” is Fraught with Danger. EWI is the world’s largest market forecasting firm. Its staff of full-time analysts led by Chartered Market Technician Robert Prechter provides 24-hour-a-day market analysis to institutional and private investors around the world.

–>
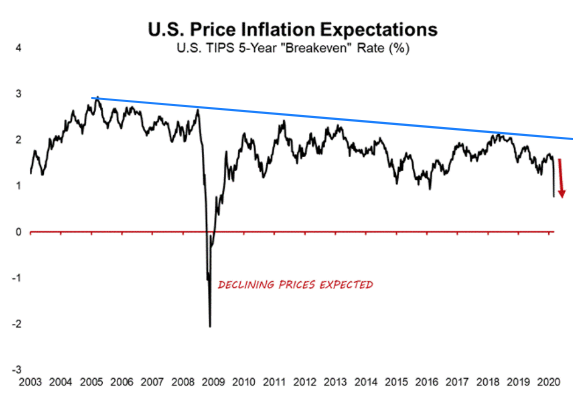
Deflation

Deflation has actually been in place for the past 15-years. (Blue line on graph below)

Slowly but surely, assets are becoming worth less.

Compare the current Market decline due to the Chinese Corona Virus with the recent Financial Market collapse of 2007-2009. We currently still have a ways to go Down if we are to match that collapse. (Red arrow)

My portfolio (including every account I have .. College Fund, Retirement Fund, short-term accounts) is:

  • 1/4 Down positions
    • Put options
    • Bearish Call Credit Option Spreads
    • Inverse Index ETFs
  • 3/4 Cash

GOLD for smart people

Gold: Learn from the Actions of the “Smartest on Wall Street”
Deep-pocketed speculators miss the big turns — but you don’t have to

By Elliott Wave International

Hedge fund managers are considered to be among the smartest people on Wall Street.

Ironically, as a group, they’re notorious for consistently being on the wrong side of major turns in the markets they trade. By contrast, a group of insiders called Commercials are generally on the right side of major market turns.

With that in mind, consider this commentary from the August 2015 Elliott Wave Financial Forecast, and note on the chart that hedge managers are synonymous with the term Large Speculators:

Large Speculators and Commercials hold a net-position size that is a multi-year extreme, and it is opposite to the position size held several weeks prior to gold’s all-time high at $1921.50 in September 2011 and at gold’s peak in October 2012 … a sentiment that is consistent with a gold rally. Despite the possibility of near-term base-building, we still anticipate that the advance, when it starts, will last several months.

Indeed, in December 2015, gold hit a low of $1046.20 and then rallied to $1375.53 on July 6, 2016, a 31% increase.

A reversal followed which sent the price of gold to a Dec. 15, 2016 low of $1122.98.

At that time, as you might have guessed, sentiment had again turned decidedly bearish.

Here’s a Dec. 29, 2016 Marketwatch headline:

2017 is the year gold drops below $1,000

Instead, however, gold started another climb. By Jan. 25, 2018, the price hit $1366.38, and the Daily Sentiment reading from trade-futures.com registered 91% bullish.

But, yet again, most big players were on the wrong side as gold began another slide.

By Aug. 16, 2018, gold hit a low of $1160.24. After the market closed on that date, our U.S. Short Term Update said:

Large Specs currently [hold] their second smallest net-long positions in 16 years at 3.5%.

In other words, 96.5% of deep-pocketed speculators were betting that gold’s price would continue to decline.

But, if you’ve been an observer of the gold market, you know that the price of gold has not looked back since then.

Instead of trend following, Elliott Wave International’s analysts use the Wave Principle to forecast the price behavior of widely traded markets, like gold.

The Elliott wave method not only helps traders to identify the main price trend, it also provides market participants with a high level of confidence in determining the maturity of a price trend.

Get important insights in the free report, “Learn How the Wave Principle Can Improve Your Trading.”

This article was syndicated by Elliott Wave International and was originally published under the headline Gold: Learn from the Actions of the “Smartest on Wall Street”. EWI is the world’s largest market forecasting firm. Its staff of full-time analysts led by Chartered Market Technician Robert Prechter provides 24-hour-a-day market analysis to institutional and private investors around the world.