The Easiest Money in History


If raising money doesn’t get any easier than this, what’s next?

By Murray Gunn

The latest data from Refinitiv shows that companies have raised a record $140 billion in the U.S. dollar junk bond market during the first quarter of this year. That beats the previous record set during the second quarter last year when companies scrambled to issue debt in a bid to raise cash during the pandemic. The three biggest issuance quarters in history have been set in the past year. With investors falling over themselves to lend money to any venture offering a U.S. dollar yield above 4%, companies are now not only finding that they can raise money easily in order to roll over existing debt, but some are using the proceeds to pay dividends to owners. It’s beyond absurd.

When a mania is in full force, though, the vast majority of participants are blind to the absurdity. Investors, for instance, think that they must lend because 4% or higher is such a juicy yield when compared with anything else. And the central banks will not let companies fail, so it’s a free lunch.

Right.

This era of central bank-induced gushing liquidity, combined with a manic social mood, has created statistics that, when looked back on in the cold light of day, will be viewed as clearly insane. At this juncture, it is seen as entirely normal, indeed clever, to give your money to someone who will not tell you what they are going to do with it. The SPAC (Special Purpose Acquisition Company) mania is a prime candidate for the financial bubble history books.

And then, when we think we’ve seen it all, along come NFTs. Non-fungible tokens are the new hot, must-have accessory in town. According to Wikipedia, “a non-fungible token is a unit of data on a digital ledger called a blockchain, where each NFT can represent a unique digital item, and thus they are not interchangeable. NFTs can represent digital files such as art, audio, videos, items in video games and other forms of creative work.” Ah, life in the cloud.

But it doesn’t matter if anyone understands them. The crowd is besotted by them and that’s all there is to it. This week, a New York Times columnist sold his column as a non-fungible token for $560,000, writing “Why can’t a journalist join the NFT party, too?”

210401 - Mg

The free lunch party is in full swing. We say enjoy it while it lasts because the hangover is going to be biblical. If you need some religion, check out the free report, Money Making Rules for Investors. Get instant access with a free Club EWI membership.

This article was syndicated by Elliott Wave International and was originally published under the headline The Easiest Money in History. EWI is the world’s largest market forecasting firm. Its staff of full-time analysts led by Chartered Market Technician Robert Prechter provides 24-hour-a-day market analysis to institutional and private investors around the world.
Dividend Portfolio Update __ WoW!

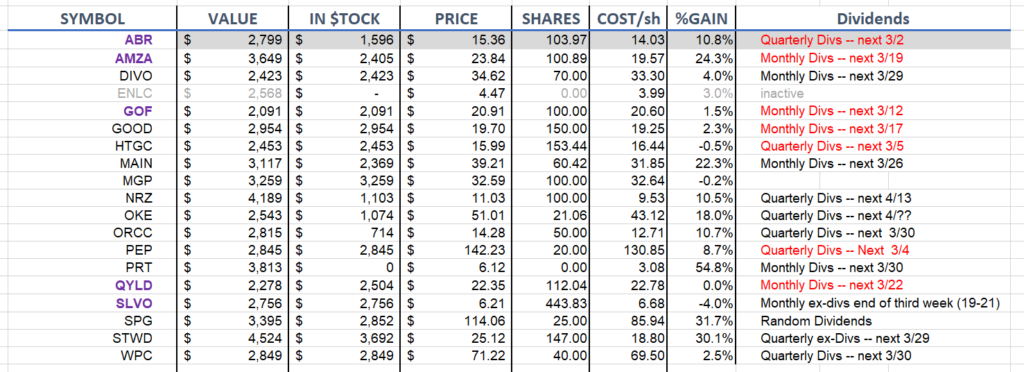
I am going to start teaching about Dividend investing and sharing my real portfolio. It is amazing! Below is my current portfolio . . all numbers are for year-to-date. Remember from my last post, I started with a real $50,000 account . . . buying up some good yielding stocks that I saw probable stock-price improvement coming as well. By investing in dividend-growing stocks whose price is also growing results in huge income over time. I’ll get into such a lesson some time in the near future. For now, here is my current portfolio:

VALUE = how much money my initial investment is worth now . . . including dividends and sales

IN $TOCK = how much money is in the stock right now

SHARES = how many shares I currently own

COST/sh = initial price @ initial investment

%GAIN = overall gain since initial purchase = VALUE over Initial Investment $$

my Dividend Portfolio

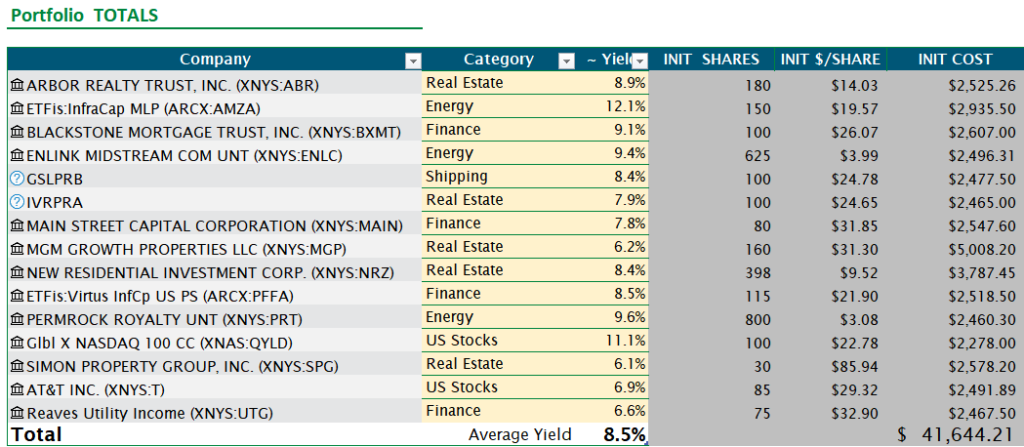
I have recently gotten into dividend investing and wanted to post it up here for all to follow. I have a $50,000 account “laying around”, so I have now dedicated it to Dividend investing. I have bought all of these stocks within this past week . . . about $41,000 worth, leaving the rest in cash as “dry powder” for more stocks I’m currently watching.

For now I am just posting my current portfolio, but will add future posts about my strategy.

as of 01/07/2021 . . . initial entries

Why Bear-Market Rallies Are So Tricky


By Elliott Wave International

Many stock market investors believe that prices have already bottomed. Numerous banks, brokers and financial firms have issued statements saying as much.

Indeed, the May Elliott Wave Theorist, a monthly publication which has offered analysis of financial and social trends since 1979, noted:

On April 28, Bloomberg interviewed four money managers to answer the question of “Where to Invest $1 Million Right Now.” Cash was not mentioned.

All these professional financial observers might be right in their assessment that the bottom is in for stocks.

Then again, the stock market rise since the March 23 low might be a bear-market rally.

If so, it certainly has “done its job,” meaning, as one of our global analysts put it in Elliott Wave International’s May Global Market Perspective (a monthly publication which covers 40+ worldwide markets):

The job of [the first, big bear-market] rally is to recreate the optimism that existed at the previous highs.

One particular sentiment that the rally has “recreated” is known by the acronym FOMO, which stands for the “fear of missing out.”

A little background: Toward the end of 2019, the FOMO sentiment was prevalent. Indeed, our December 2019 Elliott Wave Financial Forecast (a monthly, U.S.-focused publication which covers stocks, bonds, gold, silver, the U.S. dollar, the economy and more) showed this chart and said:

Last week, the percentage of bulls polled in Investors Intelligence Advisors’ Survey rose to 58.1, a new 13-month extreme. … Last month we talked about the return of FOMO, the fear of missing out on stock gains; its last major outbreak occurred as stocks approached their January 2018 highs. In November, FOMO became far more entrenched. One Bloomberg commentator called it “the age-old fear of missing out” and stated, “The end of the year is coming, when investment managers will be judged on their performance. Those who are behind have an incentive to clamber into the market now, while there is still time.” In our experience, “to clamber” is generally not a sound investment strategy.

As you know, it wasn’t long thereafter that the stock market topped. The major price moves downward were historic.

Even so, the “fear of missing out” sentiment has returned — again.

Here’s an April 7 Bloomberg headline:

FOMO Overwhelms Stock Traders Who Have Begun Ignoring the Risks

Our May Elliott Wave Financial Forecast provides more insight:

According to Google News, the number of articles referencing FOMO and “stock market” increased from 227 in December 2019 to 244 in February 2020, right through the peak in the market. In March, the market’s decline was well established, still the FOMO news count rose to 267.

So, yes, the rally has indeed “recreated” the prior optimism. One might even argue that the level of optimism is now even higher.

So, should investors take the stance that the bottom is in – or, proceed with extreme caution? 

Knowledge of the stock market’s Elliott wave pattern will help you to answer that question.

As the Wall Street classic book, Elliott Wave Principle: Key to Market Behavior, by Frost & Prechter, notes:

The primary value of the Wave Principle is that it provides a context for market analysis. This context provides both a basis for disciplined thinking and a perspective on the market’s general position and outlook.

You can read the entire, online version of Elliott Wave Principle: Key to Market Behavior, free!

You only need a Club EWI membership, which is also free. Club EWI is the world’s largest educational Elliott wave community and allows you to get Elliott wave insights on investing and trading, the economy and social trends that you will not find anywhere else.

This link gets you started: Elliott Wave Principle: Key to Market Behavior, 100% free.

This article was syndicated by Elliott Wave International and was originally published under the headline Why Bear-Market Rallies Are So Tricky. EWI is the world’s largest market forecasting firm. Its staff of full-time analysts led by Chartered Market Technician Robert Prechter provides 24-hour-a-day market analysis to institutional and private investors around the world.

Wicked E-Wave

Why This Wave is Usually a Market Downturn’s Most Wicked
The progression of mass emotions in financial markets “tends to follow a similar path each time around”

By Elliott Wave International

The Wave Principle’s basic pattern includes five waves in the direction of the larger trend, followed by three corrective waves.

In a bull market, the pattern is five up, followed by three down. In a bear market, the pattern unfolds in reverse: the five waves trend downward and the correction trends upward.

Each of these waves sports its own characteristics.

As the Wall Street classic book, Elliott Wave Principle: Key to Market Behavior, by Frost & Prechter, says:

The personality of each wave in the Elliott sequence is an integral part of the reflection of the mass psychology it embodies. The progression of mass emotions from pessimism to optimism and back again tends to follow a similar path each time around.

For example, strong price advances on high volume typically happen during wave 3 in a bull market. Of course, in a bear market, the strong price action is downward.

Returning to Elliott Wave Principle:

Third waves usually generate the greatest volume and price movement and are most often the extended wave in a series.

Let’s review an instance of a third wave in a downturn from recent financial history.

Here’s a chart and commentary from Elliott Wave International’s Aug. 21, 2015 U.S. Short Term Update:

This week’s sharp decline is clearly a third wave. It sports a steep slope with strong downside breadth and volume.

During the next trading session (August 24, 2015), the Dow fell nearly 1,100 points at the open.

As you might imagine, it would be highly helpful to learn how to anticipate third waves so one can prepare.

Indeed, Elliott Wave International has just made the 1-hour course, The Wave Principle Applied, free through May 15 for free Club EWI members. Club EWI membership allows you to get Elliott wave insights on investing and trading, the economy and social trends that you will not find anywhere else.

The Wave Principle Applied normally sells for $99, so you are encouraged to take advantage of this limited-time offer to access the course for free.

As the Wall Street classic book, Elliott Wave Principle: Key to Market Behavior, by Frost & Prechter says:

Without Elliott, there appear to be an infinite number of possibilities for market action. What the Wave Principle provides is a means of first limiting the possibilities and then ordering the relative probabilities of possible future market paths. Elliott’s highly specific rules reduce the number of valid alternatives to a minimum.

Get started with The Wave Principle Applied.

This article was syndicated by Elliott Wave International and was originally published under the headline Why This Wave is Usually a Market Downturn’s Most Wicked. EWI is the world’s largest market forecasting firm. Its staff of full-time analysts led by Chartered Market Technician Robert Prechter provides 24-hour-a-day market analysis to institutional and private investors around the world.

Cash Value in Bear Market

In Every Bear Market, One Asset Always Surges in Value — This One
“The relative value of cash will necessarily zoom higher when stocks plunge.”

By Elliott Wave International

A negative sentiment toward cash had been in place for quite some time.

Let’s go back a little more than a year when our Feb. 2019 Elliott Wave Theorist showed this chart and said:

The average cash holding in mutual funds just fell to an all-time low. All long term sentiment indicators look like [this], except for the ones that look even worse.

These headlines published later in 2019:

  • Why you shouldn’t go to cash now — in one chart (Aug. 6, CNBC)
  • 3 reasons to stay in a volatile market and not cash out (Aug. 8, Yahoo Finance)

These dismissive views toward cash are what to expect after a historically long uptrend in stocks. Many investors expected equity prices to keep climbing, so why hold cash?

Indeed, as recently as January, one highly prominent professional investor reverted back to the old saying, “Cash is trash.”

However, in the same month, our Elliott Wave Financial Forecast said:

Cash is the only answer to survival in the coming environment.

The just-published April Elliott Wave Financial Forecast followed up with this chart and said:

Equities are the opposite of cash; risk-assets that require the surrender of cash. The relative value of cash will necessarily zoom higher when stocks plunge. The chart inverts the Dow’s recent plunge to show the liftoff for a new bull market in cash. … As [the book] Conquer the Crash stated: “When the stock market reaches bottom, you can buy incredibly cheap shares that almost no one else can afford because they lost it all when their stocks collapsed.”

Speaking of a stock market bottom, are we almost there?

Well, as recently as March 28 (Marketwatch), a major financial website sported this sub-headline:

Coronavirus crash is a buying opportunity for focused, long-term investors

As the April Elliott Wave Financial Forecast relatedly noted:

The evidence of an entrenched and even surging public infatuation with shares is not simply anecdotal. A Bankrate survey of about 2500 U.S. consumers from March 20 through March 24 found that just 11% have taken investments out of the marker in first quarter of 2020, while 13% “added more investments over the last three months.” Another 66% of respondents said “they intentionally left their holdings as is.” Ten percent said “they were unaware of the current economic volatility.” So, buyers or holders of equities accounted for almost 90% of investors through the worst first quarter in the 124-year history of the Dow Jones Industrial Average. Remarkably, 47% said they cut spending over “concerns of the economy.” Just 15% said they did so because of “concerns over the stock market.”

However, Elliott wave analysis of the stock market’s price pattern suggests that many investors will soon wish they had embraced cash instead of stocks.

Now is the time to learn all you can about the Elliott wave model so you can apply this knowledge to the current stock market picture and gain insights into what to expect next.

A great educational resource is the online version of the book, Elliott Wave Principle: Key to Market Behavior by Frost & Prechter, which you can access free when you join Club EWI. Membership in Club EWI is also 100% free.

Get started.

This article was syndicated by Elliott Wave International and was originally published under the headline In Every Bear Market, One Asset Always Surges in Value — This One. EWI is the world’s largest market forecasting firm. Its staff of full-time analysts led by Chartered Market Technician Robert Prechter provides 24-hour-a-day market analysis to institutional and private investors around the world.

Don’t Buy the Dips .. yet

Stocks: Why “Buying the Dip” is Fraught with Danger
Take a look at “a dip buyer’s nightmare”

By Elliott Wave International

Investors know that the main U.S. stock indexes have tumbled very quickly.

On a historical basis, some may not realize just how quickly.

A March 23 Marketwatch headline referred to a “mind-bending stat”:

The S&P 500 has dropped 30% from peak to trough faster than any other time in history. The next three fastest were all nasty pullbacks during the Great Depression era. Yes, just 22 days for this stock market to get cut by a third.

This historically swift downturn has prompted a “buy the dip” mentality.

On March 23, a prominent founder of a financial firm told CNBC:

“I’m nibbling right now, for what it is worth.”

Other professional investors have also mentioned that they were doing a little nibbling of their own.

The sentiment expressed was that the market may have a little more downside to go, but that’s about it.

These professionals might turn out to be correct in their judgments of the market. Then again, just because stocks have fallen far and fast – doesn’t mean they can’t fall way farther.

As a historical lesson, let’s take you back 19 years, when our April 2001 Elliott Wave Financial Forecast showed this chart and said:

“If there were ever a testament to the importance of market timing, the NASDAQ over the last year is it. Anyone who bought into the euphoria at the all-time high or the bull trap highs of early September and late January, would have taken successive hits of 40%, 47% and 38%. You can bet that many people followed the “buy” advice in the media on every bounce, losing even more than the “hold-only” loss of 65% from top to bottom.”

Bear in mind, the NASDAQ continued to fall into October 2002, handing even deeper losses to investors who continued to buy on the way down.

Returning to 2020, only time will tell when the bear market has bottomed, if it hasn’t already done so.

Yet, one thing’s for sure even now: The Elliott wave model is offering its own clues about what’s next for the main stock indexes.

See for yourself – 100% free.

You see, Elliott Wave International has just made available our entire “Stocks” section of our monthly Elliott Wave Financial Forecast to Club EWI members. Joining Club EWI is also free.

Elliott Wave International has been guiding investors through bull and bear markets since 1979. From that long experience, EWI’s analysts know that at certain market junctures, they can help the most by giving everyone their latest analysis free.

Now is one of those market junctures.

Read the Financial Forecast excerpt now, free.

This will help you understand how the markets got to this juncture — and, more importantly what’s likely next.

Also, please feel free to share this special excerpt with friends and family.

Again, simply follow this link:

Read the Financial Forecast excerpt now, free.

This article was syndicated by Elliott Wave International and was originally published under the headline Stocks: Why “Buying the Dip” is Fraught with Danger. EWI is the world’s largest market forecasting firm. Its staff of full-time analysts led by Chartered Market Technician Robert Prechter provides 24-hour-a-day market analysis to institutional and private investors around the world.

This article was syndicated by Elliott Wave International and was originally published under the headline Stocks: Why “Buying the Dip” is Fraught with Danger. EWI is the world’s largest market forecasting firm. Its staff of full-time analysts led by Chartered Market Technician Robert Prechter provides 24-hour-a-day market analysis to institutional and private investors around the world.

–>

Deflation

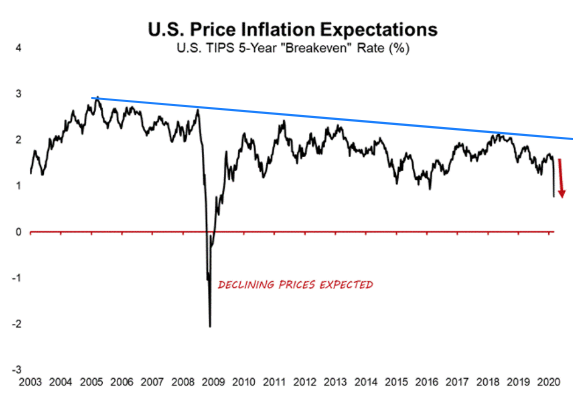
Deflation has actually been in place for the past 15-years. (Blue line on graph below)

Slowly but surely, assets are becoming worth less.

Compare the current Market decline due to the Chinese Corona Virus with the recent Financial Market collapse of 2007-2009. We currently still have a ways to go Down if we are to match that collapse. (Red arrow)

My portfolio (including every account I have .. College Fund, Retirement Fund, short-term accounts) is:

  • 1/4 Down positions
    • Put options
    • Bearish Call Credit Option Spreads
    • Inverse Index ETFs
  • 3/4 Cash

GOLD for smart people

Gold: Learn from the Actions of the “Smartest on Wall Street”
Deep-pocketed speculators miss the big turns — but you don’t have to

By Elliott Wave International

Hedge fund managers are considered to be among the smartest people on Wall Street.

Ironically, as a group, they’re notorious for consistently being on the wrong side of major turns in the markets they trade. By contrast, a group of insiders called Commercials are generally on the right side of major market turns.

With that in mind, consider this commentary from the August 2015 Elliott Wave Financial Forecast, and note on the chart that hedge managers are synonymous with the term Large Speculators:

Large Speculators and Commercials hold a net-position size that is a multi-year extreme, and it is opposite to the position size held several weeks prior to gold’s all-time high at $1921.50 in September 2011 and at gold’s peak in October 2012 … a sentiment that is consistent with a gold rally. Despite the possibility of near-term base-building, we still anticipate that the advance, when it starts, will last several months.

Indeed, in December 2015, gold hit a low of $1046.20 and then rallied to $1375.53 on July 6, 2016, a 31% increase.

A reversal followed which sent the price of gold to a Dec. 15, 2016 low of $1122.98.

At that time, as you might have guessed, sentiment had again turned decidedly bearish.

Here’s a Dec. 29, 2016 Marketwatch headline:

2017 is the year gold drops below $1,000

Instead, however, gold started another climb. By Jan. 25, 2018, the price hit $1366.38, and the Daily Sentiment reading from trade-futures.com registered 91% bullish.

But, yet again, most big players were on the wrong side as gold began another slide.

By Aug. 16, 2018, gold hit a low of $1160.24. After the market closed on that date, our U.S. Short Term Update said:

Large Specs currently [hold] their second smallest net-long positions in 16 years at 3.5%.

In other words, 96.5% of deep-pocketed speculators were betting that gold’s price would continue to decline.

But, if you’ve been an observer of the gold market, you know that the price of gold has not looked back since then.

Instead of trend following, Elliott Wave International’s analysts use the Wave Principle to forecast the price behavior of widely traded markets, like gold.

The Elliott wave method not only helps traders to identify the main price trend, it also provides market participants with a high level of confidence in determining the maturity of a price trend.

Get important insights in the free report, “Learn How the Wave Principle Can Improve Your Trading.”

This article was syndicated by Elliott Wave International and was originally published under the headline Gold: Learn from the Actions of the “Smartest on Wall Street”. EWI is the world’s largest market forecasting firm. Its staff of full-time analysts led by Chartered Market Technician Robert Prechter provides 24-hour-a-day market analysis to institutional and private investors around the world.

FOMO Stock Trading

Investors: Are You in Danger of Emotion-Driven Decisions? You’re Not Alone.
Or…Your Defense Against FOMO

By Elliott Wave International

As the winter holidays draw near, many of us will fall victim to the affliction we call “S.N.O.M.O.” — the Sudden Need of More Objects (to own, play with… and eventually, store in the basement).

Lists and budgets are no match for SNOMO once we take our first steps into a big-box store with its flashing signs and blazing blue lights. Within minutes, a powerful urge takes over and suddenly we’re leaping in front of an old lady with a cane for the last cat-massage combing kit despite not knowing a single person who owns a cat, self included.

Our friends at Elliott Wave International assert that the same fear and emotion driving holiday shoppers to make irrational purchases ALSO drives the year-round speculation by investors in uber-hyped “it” markets.

To investors and traders, this phenomenon is known as FOMO — the Fear of Missing Out. And we can’t cure shoppers’ SNOMO, for investors the ultimate defense against the sudden need of more is Elliott wave analysis.

The Wall Street bestseller and ultimate resource guide on all things Elliott., Elliott Wave Principle — Key to Market Behavior writes:

“The Wave Principle exists partly because man refuses to learn from history, because he can always be counted upon to be led to believe that two and two can and do make five.

“He can be led to believe that the laws of nature do not exist (or more commonly, ‘do not apply in this case’) … and that the fears which reason supports will evaporate if they are ignored or derided.”

Essentially, the Wave Principle acts as a mood-stabilizer to man’s innate fears of missing out on the next big thing. It provides a defined forecasting method for looking at markets, including a clear set of rules and guidelines, which govern the extent and direction of trends.

One of the starkest examples of Elliott waves combatting investor emotion comes via the recent history in bitcoin. In late 2017, the cryptocurrency had gone from a “fake,” “fringe” novelty to the new darling of Wall Street — after rocketing in 2017 alone from below $1000 per coin to above $20,000 by December of that year.

Every major company from Apple Store to Zappos to Playboy began accepting Bitcoin as a payment medium. Average citizens were literally mortgaging their homes to buy the “hottest new investment trend” (Dec. 12 Forbes). And mainstream analysts were re-upping their bullish bitcoin forecasts for the year ahead, as these headlines from December 2017 reveal:

  • “Bitcoin could easily reach $40,000 by the end of 2018.” (CNBC)
  • “Bitcoin: Mystery Investor Bets a million it hits $50,000.” (Forbes)
  • “Bitcoin Will Surge Above $100,000 in 2018″ (CNBC)

As one Wall Street bitcoin strategist summarized in a December 22, 2017 article: “Make no mistake – the long-term bull market is firmly intact.” (The Street)

The pressure to get in on Bitcoin before the next thousandth-percent price surge could be felt the world over. Investors collective emotion was at an all-time high, and most speculators espoused the sentiment alluded to in Wave Principle — Key to Market Behavior — namely; that the rules of nature and gravity didn’t apply to bitcoin.

By stark contract, Elliott Wave International’s December 2017 Elliott Wave Financial Forecast took an objective stance based on bitcoin’s completed bullish Elliott wave pattern and identified the hallmarks of a late-stage bubble, issuing this warning to crypto-crazed investors:

“A rising sea of euphoria, ever-higher price projections and the capitulation of financial sophisticates only reinforce our stance:

“We are more convinced than ever that bitcoin will disappoint its late-coming enthusiasts.”

Result: From its December 2017 peak of near $20,0000 Bitcoin plummeted 70%-plus to below $6000 per coin in just two months! (By the end of 2017, bitcoin was trading near $3000, an 80% crash.)

In fact, the first quarter of 2018 was the worst period for cryptocurrencies in history. Here again, Elliott Wave Principle — Key to Market Behavior offers singular insight into the psychological machinations of this type of market’s reversal:

“Panics are sudden emotional mass realizations of reality, as are the initial upswings from the bottoms of those panics. At these points, reason suddenly impresses itself upon the mass psyche, saying, ‘Things have gone too far. The current levels are not justified by reality.’

“To the extent that reason is disregarded, then, will be the extent of the extremes of mass emotional swings and their mirror, the market.”

For any investor, fomo begets disappointment and regret. Yet, nobody is immune. In October 2017, JP Morgan Chase’s CEO called bitcoin a “fraud” and said, “If you’re stupid enough to buy it, you’ll pay the price.” Two months later, amidst the crypto hype and glitz, the bank started prepping its clients for investing in bitcoin futures on the Chicago Mercantile Exchange.

FOMOA new bitcoin-like “it” market is born every day. Whether you approach those markets led by emotion, or by a clear Elliott wave discipline, is your choice. All free Club EWI members get instant, no-cost access to the complete Elliott Wave Principle — Key to Market Behavior the minute they sign up. Join them today and learn to keep your emotions in check with Elliott wave analysis!