I want to start sharing my trading results each month on this blog. I started this method of trading/investing in the Spring of 2022 .. just a few months ago .. and am fine-tuning it as I go along. Lots of lessons learned the first month or two, but have been doing great the past few months.
The key was to create a method of using my money to make money that was low-stress and yet steadily made a good stream of income. I had tried dividend investing last year and it worked quite well … but I wanted my account to grow faster. So I took a chunk of money and opened an options trading account.
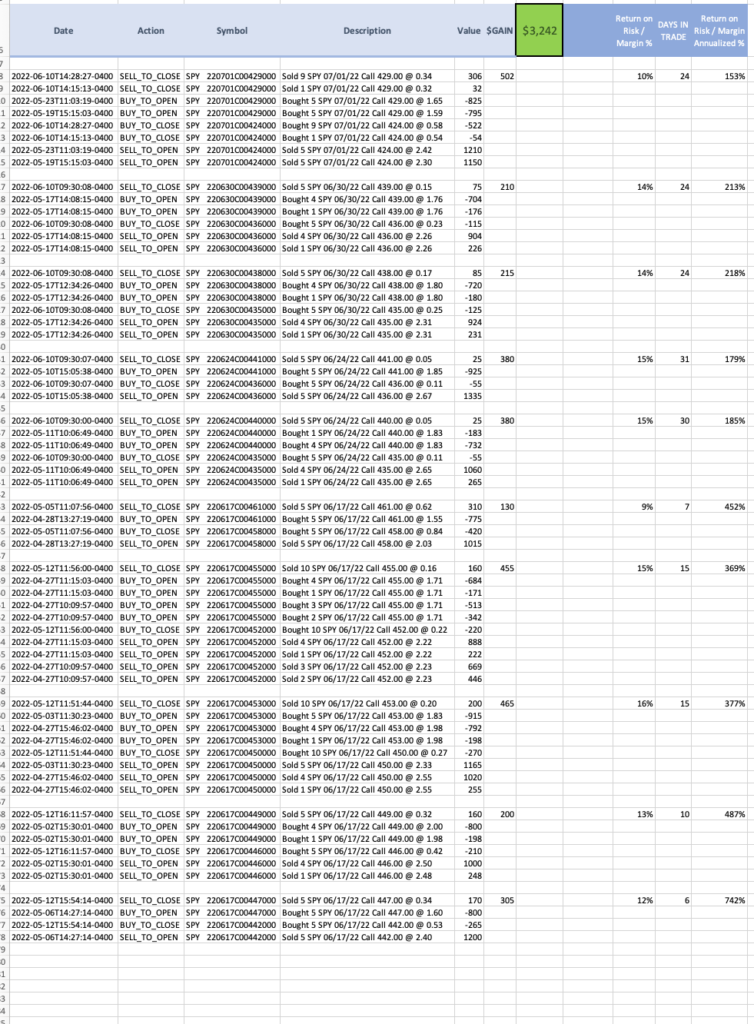
February and March were “learning months” and then April started the UP-trend nicely .. followed by a great May and June and July (so far). SO –> I thought I would start sharing my trading results/details. Starting May I had about $30,000 in the account and have profited over 10% each month. Nothing super exciting .. not a “get rich quick” scheme . . . but certainly the low-stress and steady stream of income. If continued, this will amount to a doubling of my money every year. I have a lucrative regular job so I do not need to touch this money until I “retire”. In five years it’ll be into the million$ .. then I can retire.
Anyway . . . here are my trades for May-2022 . . . I will continue to post each month’s results as I gather them together. Enjoy !!
right-click to download or open in new tab and zoom-in
Here’s a More Reliable “Recession Indicator” Versus an Inverted Yield Curve “The lead time between past inverted curves and economic contractions is widely variable”
By Elliott Wave International
Longer-dated bonds generally yield more than shorter-dated bonds to compensate an investor for assuming the greater risk of tying up money for a longer time.
As examples, 30-year government bonds have historically offered investors a higher yield than 10-year notes, and 10-year notes generally provide a higher yield than 2-year notes.
However, there are times when the yield on a shorter-term bond is higher than a longer-term bond. This is known as an inverted yield curve, and many market observers view this occurrence as a signal that a recession may be just around the corner.
For example, a March 28 CNBC headline said:
5-year and 30-year Treasury yields invert for the first time since 2006, fueling recession fears
The next day, on March 29 and then again on April 1, the yield on 2-year U.S. treasury notes climbed above the yield on 10-year U.S. treasury notes — prompting more potential recession talk. A key reason why is that a yield inversion has preceded every U.S. recession since at least 1955.
However, here are some important insights from our just-published April Elliott Wave Financial Forecast, a monthly publication which provides analysis of major U.S. financial markets:
The lead time between past inverted curves and economic contractions is widely variable … and usually does not occur until after the curve un-inverts. Since stock prices lead the economy, it is more reliable to monitor equities to estimate when the onset of an economic contraction may occur.
Indeed, here’s some historical evidence of that from Robert Prechter’s landmark book, The Socionomic Theory of Finance, which says:
It is important to understand that socionomic causality does not predict that each stock market decline will produce an official recession as defined by the National Bureau of Economic Research; it predicts that stock market declines and advances will reliably lead rather than follow whatever official recessions and recoveries do occur.
So, keep an eye on the stock market’s Elliott wave pattern for a clue about what’s ahead for the economy.
If you’re new to Elliott wave analysis, or simply need a refresher on the topic, you are encouraged to read Frost & Prechter’s Wall Street classic, Elliott Wave Principle: Key to Market Behavior.
Here’s a quote from the book:
In the 1930s, Ralph Nelson Elliott discovered that stock market prices trend and reverse in recognizable patterns. The patterns he discerned are repetitive in form but not necessarily in time or amplitude. Elliott isolated five such patterns, or “waves,” that recur in market price data. He named, defined and illustrated these patterns and their variations. He then described how they link together to form larger versions of themselves, how they in turn link to form the same patterns of the next larger size, and so on, producing a structured progression. He called this phenomenon The Wave Principle.
You may be interested in knowing that you can read the entire online version of Elliott Wave Principle: Key to Market Behavior for free.
You can get that free access by joining Club EWI, the world’s largest Elliott wave educational community.
Club EWI membership is free and allows you complimentary access to a wealth of Elliott wave educational resources on investing and trading without any obligation.
This article was syndicated by Elliott Wave International and was originally published under the headline Here’s a More Reliable “Recession Indicator” Versus an Inverted Yield Curve. EWI is the world’s largest market forecasting firm. Its staff of full-time analysts led by Chartered Market Technician Robert Prechter provides 24-hour-a-day market analysis to institutional and private investors around the world.
Just letting you know that I will be posting here more often now. It has been a while since I was active on my board here. I have been spending time honing my trading system.
I am now a wise option seller . . for consistent, less stress, profits.
I am currently short various bearish, way out of the money, May and April SPY Call option Credit Spreads whose values are dwindling away into my brokerage account . . the profitable premiums I collected staying there.
I will start posting more here about my Trading System Methods.
“Everybody’s Getting Rich (and Having Fun) Except Me” The idea of “missing out” on stock market gains “literally generates fear in many people”
By Elliott Wave International
Hardly anyone wants to miss the party — whether on Wall Street or elsewhere.
Thus, the acronym FOMO — which stands for the “fear of missing out” — is in vogue. After a 12-years long bull market, the acronym has appeared in many financial articles.
Yet, the acronym was coined years before the current bull market.
As the March 2019 Elliott Wave Financial Forecast, a monthly publication which provides analysis of major U.S. financial markets, noted:
The “fear of missing out” and its abbreviation were coined by Dr. Dan Herman. … It was first published in The Journal of Brand Management in 2000, coincident with the front edge of the Great Peaking Process. … After more than 200 years of rising stock prices, not being in the stock market literally generates fear in many people. The underlying cultural dynamic is also appropriate as it coincides perfectly with the long-term peak in social mood.
Social mood also governs attitudes and behaviors in society-at-large, including social life.
As a June 7 New York magazine article says:
The city runs on FOMO, a connoisseurship of opportunities and possibilities; the catechism of “Did you get invited, are you on the list, can you get a table?”; the performance of plans.
So, the “fear of missing” out on rising stock prices goes hand-in-hand with the “fear of missing out” on a fun social life. The desire to “see and be seen” and “live it up” is especially pronounced during times of an exceptionally positive social mood (think the Roaring ’20s).
So, social mood is all encompassing. And, returning to the financial aspects, here’s the latest on that front from Marketwatch (May 25):
[The] FOMO ETF [started] trading on the Cboe Options Exchange on [May 25], providing the market with a new tool for leveraging the retail trading boom by investing in all the buzziest “meme stocks” and funds from special-purpose acquisition corporations … to crypto-adjacent investments.
Right now, hardly anyone appears to be contemplating the total opposite of FOMO — which one of Elliott Wave International’s analysts said is the acronym FOBI. It stands for the “fear of being in.”
In other words, when social mood shifts from positive to negative (ushering in the next bear market), expect the “fear of being in” to replace the “fear of missing out.”
Remember, at the end of the 1920s, the stock market crashed. Social life — which had been characterized by vibrancy — was soon covered by a heavy blanket of gloom. The Wave Principle suggests that the next financial and social shift might be even more dramatic.
If you’d like to learn about the Wave Principle, you can do so by reading the online version of Frost & Prechter’s Wall Street classic, Elliott Wave Principle: Key to Market Behavior for free.
Here’s a quote from the book:
It is a thrilling experience to pinpoint a turn, and the Wave Principle is the only approach that can occasionally provide the opportunity to do so.
The ability to identify such junctures is remarkable enough, but the Wave Principle is the only method of analysis that also provides guidelines for forecasting. Many of these guidelines are specific and can occasionally yield stunningly precise results.
All that’s required for free access to the book is a Club EWI membership — which is also free.
Club EWI is the world’s largest Elliott wave educational community (about 350,000 members and growing rapidly) and offers members free access to a wealth of Elliott wave resources on investing and trading.
This article was syndicated by Elliott Wave International and was originally published under the headline “Everybody’s Getting Rich (and Having Fun) Except Me”. EWI is the world’s largest market forecasting firm. Its staff of full-time analysts led by Chartered Market Technician Robert Prechter provides 24-hour-a-day market analysis to institutional and private investors around the world.
If raising money doesn’t get any easier than this, what’s next?
By Murray Gunn
The latest data from Refinitiv shows that companies have raised a record $140 billion in the U.S. dollar junk bond market during the first quarter of this year. That beats the previous record set during the second quarter last year when companies scrambled to issue debt in a bid to raise cash during the pandemic. The three biggest issuance quarters in history have been set in the past year. With investors falling over themselves to lend money to any venture offering a U.S. dollar yield above 4%, companies are now not only finding that they can raise money easily in order to roll over existing debt, but some are using the proceeds to pay dividends to owners. It’s beyond absurd.
When a mania is in full force, though, the vast majority of participants are blind to the absurdity. Investors, for instance, think that they must lend because 4% or higher is such a juicy yield when compared with anything else. And the central banks will not let companies fail, so it’s a free lunch.
Right.
This era of central bank-induced gushing liquidity, combined with a manic social mood, has created statistics that, when looked back on in the cold light of day, will be viewed as clearly insane. At this juncture, it is seen as entirely normal, indeed clever, to give your money to someone who will not tell you what they are going to do with it. The SPAC (Special Purpose Acquisition Company) mania is a prime candidate for the financial bubble history books.
And then, when we think we’ve seen it all, along come NFTs. Non-fungible tokens are the new hot, must-have accessory in town. According to Wikipedia, “a non-fungible token is a unit of data on a digital ledger called a blockchain, where each NFT can represent a unique digital item, and thus they are not interchangeable. NFTs can represent digital files such as art, audio, videos, items in video games and other forms of creative work.” Ah, life in the cloud.
But it doesn’t matter if anyone understands them. The crowd is besotted by them and that’s all there is to it. This week, a New York Times columnist sold his column as a non-fungible token for $560,000, writing “Why can’t a journalist join the NFT party, too?”
The free lunch party is in full swing. We say enjoy it while it lasts because the hangover is going to be biblical. If you need some religion, check out the free report, Money Making Rules for Investors. Get instant access with a free Club EWI membership.
This article was syndicated by Elliott Wave International and was originally published under the headline The Easiest Money in History. EWI is the world’s largest market forecasting firm. Its staff of full-time analysts led by Chartered Market Technician Robert Prechter provides 24-hour-a-day market analysis to institutional and private investors around the world.
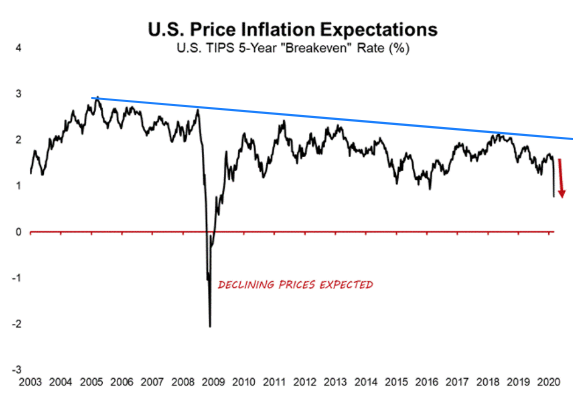
Deflation has actually been in place for the past 15-years. (Blue line on graph below)
Slowly but surely, assets are becoming worth less.
Compare the current Market decline due to the Chinese Corona Virus with the recent Financial Market collapse of 2007-2009. We currently still have a ways to go Down if we are to match that collapse. (Red arrow)
My portfolio (including every account I have .. College Fund, Retirement Fund, short-term accounts) is:
When the Uber-Wealthy Bash the Wealth Gap, It’s Time to Worry
By Murray Gunn
Multi-billionaire hedge fund manager Ray Dalio recently published a 7500-word call to reform American capitalism. Noting that the nation’s wealth gap is the “highest since the 1930s,” Dalio wrote that rather than distributing income equally, capitalism is “producing self-reinforcing spirals up for the haves and down for the have-nots” which “pose existential threats to the United States,” and amount to a “national emergency.”
Parts of Dalio’s message sound eerily close to another article authored by another uber-successful capitalist, John J. Raskob. In his piece “Everybody Aught to Be Rich,” Raskob writes:
“A man is rich when he has an income which is sufficient to support him and his family in a decent and comfortable manner. That amount of prosperity aught to be attainable by anyone. … It is quite true that wealth is not so evenly distributed.”
Incredibly, Raskob’s piece was published 90 years ago in the July 31 issue of Ladies’ Home Journal — in the year 1929! The two men’s ideas on how to reconcile their generation’s income inequality couldn’t be more different. But they share one important commonality — each sounds the alarm about wealth disparity. And throughout history, that warning has signaled an end to the boom that begot the very wealth disparity in dispute. Case in point, the year of Raskob’s article — 1929 — saw the greatest stock market peak to date and subsequent period of wealth destruction known as the Great Depression.
This chart shows how broad the wealth gap has become in not just the U.S., but also across the pond in the U.K. It divides each country’s stock market by average earnings. In 2019, it takes the average U.S. citizen 123 hours of labor to buy one S&P share. In the U.K., it’s 305 hours to buy one share of the FTSE All-Share Index.
The chart also shows how the greater the wealth gap becomes, the closer the instrument of that wealth — the stock market — gets to significant peaks. Note the last two times when hours needed to buy one share reached a similar extreme. The first time was in 1999-2000. That year marked the peak in both measures, when it took 407 hours for the average Brit to buy one share of the FTSE All-Share and 108 hours for an American worker to buy one share of the S&P 500. That period also saw a wave of Dalio-esque rebukes of capitalism with a raft of articles like “New Politics of Inequality” (Sept. 22 NYT), “Globalization Widens Rich-Poor Gap” (July 13 NYT), and a 1999 United Nations report warning “the world is heading toward grotesque inequalities, neither sustainable nor worth sustaining.” In November 1999, we cited the “growing gulf between haves and have-nots” as a profound signal of a boom cycle nearing its end and wrote:
“A bear market is nature’s way of redistributing wealth, but apparently, at a trend change as big as this one, people just cannot wait to get in there and lend a hand.”
Two months later, the dot.com bubble bust and the Dow Jones Industrial Average dropped 40%, 2-year long bear market.
The second extreme in hours needed to buy one share came near peak territory in 2006-7. Again, main street cited corporate America’s failures, as the widening wealth gap became a “chasm” and social media became a soap box for anti-capitalist rebukes:
“Wealth Gap Has Widened More than 50%” (August 29 CNN Money)
“Haves and Have-Nots: Income Inequality in America” (Feb. 5 NPR)
“The Rich, the Poor and the Growing Gap Between Them” (June 15 Economist)
By year’s end, the December 2006 Elliott Wave Financial Forecast went on bearish red alert and said:
The timing of the last wealth disparity alarm makes a more important point. They tend to arrive at big peaks.” (See the full commentary here.)
Two months later, the KBW Bank Index peaked, heralding in the global financial meltdown — in October 2007 came the deepest stock market decline since the Great Depression. At the February 2009 bottom, the hours-work-per-share in the U.S. and U.K. dropped to 184 and 39 respectively.
Today, the lint of acrimony over the widening gulf between the 1% and everyone else is smoldering once again, as these 2019 headlines evince:
“America’s 1% Hasn’t Controlled This Much Wealth Since Before the Great Depression” (Feb. 24 MarketWatch)
“Wealth Inequality is Way Worse Than You Think” (Feb. 29 Forbes)
“Richest 1% on Target to Own Two-Thirds of All Wealth by 2030” (April 7 The Guardian)
But as Dalio himself observed: “Most everything happens over and over again through history, and by observing and thinking through these patterns, one can better understand how reality works and acquire timeless and universal principles for dealing with it better.” I couldn’t agree more. Dalio himself is both observer and part of the boom-bust pattern underway now, one in which I fully anticipate the concerns over inequality to disappear as the playing field becomes inexorably leveled.