Expect a Once-in-a-Lifetime Debt Crisis

Why You Should Expect a Once-in-a-Lifetime Debt Crisis
U.S. credit card debt surpasses $1 trillion

By Elliott Wave International

On a national level, a debt crisis occurs when a country is unable to pay back its government debt. This might result from government spending exceeding tax revenues for an extended period.

On an individual level, a crisis can result from too little income and too much debt — that simple. This sometimes means defaulting on a car loan, for example, or even declaring bankruptcy.

Part 1 of the June Elliott Wave Theorist, a publication which covers major financial and cultural trends, said:

A debt crisis is brewing, and higher long term interest rates will add to the pressure.

Indeed, as Kiplinger noted on Aug. 18:

Credit Card Use Spikes for Cash-Strapped Consumers
Credit card use amps up as consumers reckon with inflation and higher interest rates; 39% of Americans living paycheck-to-paycheck, study shows.

The August Elliott Wave Theorist had more to say about the looming debt crisis as it showed these side-by-side charts:

Excess savings US households built up during the pandemic are nearly gone. …

At the same time, consumers are borrowing to stay alive, driving indebtedness to yet another milestone: Total credit card debt in the U.S. has just surpassed $1 trillion. Will consumers be able to pay it off?

They had better do it fast, because credit-card interest rates have just soared to a new all-time high above 20%!

And bond yields (and interest rates) continue to climb (Reuters, Sept. 21):

TREASURIES-Two-year yields hit 17-year highs …

Elliott Wave International warned subscribers to prepare back in 2020 when interest rates were near zero.

Of course, a lot of people are wondering if rates are headed even higher.

Remember, it’s the market which determines the direction of interest rates; the Fed merely follows.

A key way to keep tabs on widely traded financial markets is to employ the Elliott wave method.

If you’d like to delve into the details of Elliott wave analysis, read Frost & Prechter’s book, Elliott Wave Principle: Key to Market Behavior. Here’s a quote from this Wall Street classic:

“When you have eliminated the impossible, whatever remains, however improbable, must be the truth.” Thus eloquently spoke Sherlock Holmes to his constant companion, Dr. Watson, in Arthur Conan Doyle’s The Sign of Four. This advice is a capsule summary of what you need to know to be successful with Elliott. The best approach is deductive reasoning. By knowing what Elliott rules will not allow, you can deduce that whatever remains is the proper perspective, no matter how improbable it may seem otherwise. By applying all the rules of extensions, alternation, overlapping, channeling, volume and the rest, you have a much more formidable arsenal than you might imagine at first glance. Unfortunately for many, the approach requires thought and work and rarely provides a mechanical signal. However, this kind of thinking, basically an elimination process, squeezes the best out of what Elliott has to offer and besides, it’s fun! We sincerely urge you to give it a try.

Club EWI members get free access to the entire online version of Elliott Wave Principle: Key to Market Behavior.

Club EWI is the world’s largest Elliott wave educational community and is free to join. Besides the book, members also enjoy complimentary access to a wealth of other Elliott wave resources on investing and trading.

Get started now by following this link: Elliott Wave Principle: Key to Market Behaviorfree and instant access for Club EWI members.

This article was syndicated by Elliott Wave International and was originally published under the headline Why You Should Expect a Once-in-a-Lifetime Debt Crisis. EWI is the world’s largest market forecasting firm. Its staff of full-time analysts led by Chartered Market Technician Robert Prechter provides 24-hour-a-day market analysis to institutional and private investors around the world.

Corporate Bonds: “The Next Shoe to Drop”

Corporate Bonds: “The Next Shoe to Drop”
“The neckline has been broken over the last few days”

By Elliott Wave International

A “calamity” is likely ahead for corporate bonds, says our head of global research, Murray Gunn.

Some of Murray’s analysis involves the head and shoulders, a classic technical chart pattern. In case you’re unfamiliar with it, here’s an illustration along with an explanation from one of our past publications:

A head-and-shoulders is a reversal pattern that consists of three price extremes. Market technicians refer to [them] as the left shoulder, head, and right shoulder. …it takes a break of the neckline to confirm a reversal… [and it’s] not just a bearish reversal formation. Inverted head-and-shoulders mark bottoms.

With that in mind, here’s a chart and commentary which Murray provided for the April Global Market Perspective, a monthly Elliott Wave International publication which covers 50-plus financial markets:

The chart … shows the relative performance of corporate bonds, as proxied by the iShares iBoxx $ Investment Grade Corporate Bond ETF (ticker LQD) versus the iShares 7-10 Year Treasury Bond ETF (ticker IEF). A distinct Head and Shoulders pattern exists where the neckline has been broken over the last few days. The corporate bond market has held in reasonably well over the last year, but we fully expect this sector to be the next shoe to drop.

Don’t count on the ratings services to provide timely warnings. In the past, downgraded ratings have sometimes come only after most if not all the damage was done.

Remember Enron? The company still had an “investment grade” rating just four days before it collapsed. Ratings services also missed the 1995 debacle at Barings Bank. Olympia and York of Canada is another historical example: the largest real estate developer in the world at the time had a AA rating on its debt in 1991. Less than a year later, it went bankrupt.

Getting back to the present, Murray Gunn also notes:

When … corporate loans are re-set this year, there are going to be a few deep breaths being taken, and more than a fair share of tightened sphincters!

And, speaking of chart patterns of financial markets, another way to monitor the bond market is to use Elliott wave analysis.

If you’d like to delve into the details of this method of analysis, read Frost & Prechter’s Wall Street classic, Elliott Wave Principle: Key to Market Behavior. Here’s a quote from the book:

If indeed markets are patterned, and if those patterns have a recognizable geometry, then regardless of the variations allowed, certain price and time relationships are likely to recur. In fact, experience shows that they do.

It is our practice to try to determine in advance where the next move will likely take the market. One advantage of setting a target is that it gives a sort of backdrop against which to monitor the market’s actual path. This way, you are alerted quickly when something is wrong and can shift your interpretation to a more appropriate one if the market does not do what you expect. The second advantage of choosing a target well in advance is that it prepares you psychologically for buying when others are selling out in despair, and selling when others are buying confidently in a euphoric environment.

If you’d like to read the entire online version of Elliott Wave Principle: Key to Market Behavior, you may do so for free once you become a member of Club EWI, the world’s largest Elliott wave educational community. A Club EWI membership is also free.

Join now by following this link: Elliott Wave Principle: Key to Market Behaviorget free and instant access.

This article was syndicated by Elliott Wave International and was originally published under the headline Corporate Bonds: “The Next Shoe to Drop”. EWI is the world’s largest market forecasting firm. Its staff of full-time analysts led by Chartered Market Technician Robert Prechter provides 24-hour-a-day market analysis to institutional and private investors around the world.

Stocks and Economy: Why 2022 May Have Just Been the Preview


“Fight the inertia that will keep you from taking action to prepare for the downturn”

By Elliott Wave International

The main show is likely about to begin.

2022 may have just been a preview of what’s ahead for stocks and the economy, which Robert Prechter’s Last Chance to Conquer the Crash warned about nearly a year ago, and our Global Market Perspective discussed at the start of 2022.

Let’s start with that warning from the January 7, 2022, Global Market Perspective, a monthly Elliott Wave International publication that covers 50-plus worldwide financial markets, via these charts and commentary:

The blue-chip Dow Industrials and S&P 500 … managed to eke out new highs in the first two trading days of 2022. There is a good chance that Wednesday’s trend reversal is the start of a long-term decline.

The “Wednesday” referenced was Jan. 5 and indeed, an all-time high for the Dow Industrials occurred on that very date, with the S&P 500 hitting its high on Jan. 4. Mind you, the Global Market Perspective‘s forecast was made in real-time — just two and three days, respectively, after those all-time highs registered.

As you know, the blue-chips have been in a downtrend since, albeit accompanied by some very sharp rallies — which is not unusual during downtrends.

Let’s now turn our attention to Robert Prechter’s Last Chance to Conquer the Crash, which, as a reminder, was published nearly a year ago and warned of a major economic contraction ahead. This is from the book:

Fight the inertia that will keep you from taking action to prepare for the downturn. Start taking steps now. … Think globally, not just domestically.

Yes, when the good times are rolling and stock market indexes are reaching new all-time highs, it can seem unnecessary to prepare for a downturn.

But, as you read these headlines, many people likely wished they had:

  • Household wealth down by $13.5 trillion in 2022, second-worst destruction on record (Marketwatch, Dec. 9)
  • Tech Layoffs in U.S. Send Foreign Workers Scrambling to Find New Jobs (The New York Times, Dec. 9)
  • Economists: A US housing recession has already arrived (The Hill, Dec. 7)
  • Defaults Loom as Poor Countries Face an Economic Storm (The New York Times, Dec. 3)
  • The UK economy is sliding into recession and Europe is set to follow (CNN, Nov. 11)
  • China’s super-rich see fortunes plunge as economy slows (The Guardian, Nov. 7)

There are many more similar headlines.

The stance of Elliott Wave International is that these headlines represent only an inkling of what’s likely ahead.

Keep in mind that the stock market leads and the economy follows. In other words, a downturn in the stock market is generally followed by a downturn in the economy and an upturn in the stock market is generally followed by improving economic conditions.

So, it would be a good idea to keep on top of the Elliott wave pattern of the stock market in which you are interested — whether it’s the U.S., another nation or many nations. Elliott wave analysis will help you to anticipate what’s next for a given stock market index or indexes. Hence, you can also anticipate what’s down the road for the economy. As you might imagine, Elliott wave analysis offers no guarantees, but it’s the best analysis of financial markets of which Elliott Wave International knows.

If you’re unfamiliar with Elliott wave analysis and would like to learn about it, read Frost & Prechter’s Elliott Wave Principle: Key to Market Behavior — the definitive text on the Elliott wave model. Here’s a quote from the book:

The Wave Principle is governed by man’s social nature, and since he has such a nature, its expression generates forms. As the forms are repetitive, they have predictive value.

Sometimes the market appears to reflect outside conditions and events, but at other times it is entirely detached from what most people assume are causal conditions. The reason is that the market has a law of its own. It is not propelled by the external causality to which one becomes accustomed in the everyday experiences of life. The path of prices is not a product of news. Nor is the market the cyclically rhythmic machine that some declare it to be. Its movement reflects a repetition of forms that is independent both of presumed causal events and of periodicity.

The market’s progression unfolds in waves. Waves are patterns of directional movement.

If you’d like to read the entire online version of this Wall Street classic, you may do so for free once you join Club EWI — the world’s largest Elliott wave educational community. A Club EWI membership is also free and allows you complimentary access to a wealth of Elliott wave resources on investing and trading.

Just follow this link: Elliott Wave Principle: Key to Market Behaviorget instant and free access.

This article was syndicated by Elliott Wave International and was originally published under the headline Stocks and Economy: Why 2022 May Have Just Been the Preview. EWI is the world’s largest market forecasting firm. Its staff of full-time analysts led by Chartered Market Technician Robert Prechter provides 24-hour-a-day market analysis to institutional and private investors around the world.

Stock Market Recession Indicator

Here’s a More Reliable “Recession Indicator” Versus an Inverted Yield Curve
“The lead time between past inverted curves and economic contractions is widely variable”

By Elliott Wave International

Longer-dated bonds generally yield more than shorter-dated bonds to compensate an investor for assuming the greater risk of tying up money for a longer time.

As examples, 30-year government bonds have historically offered investors a higher yield than 10-year notes, and 10-year notes generally provide a higher yield than 2-year notes.

However, there are times when the yield on a shorter-term bond is higher than a longer-term bond. This is known as an inverted yield curve, and many market observers view this occurrence as a signal that a recession may be just around the corner.

For example, a March 28 CNBC headline said:

5-year and 30-year Treasury yields invert for the first time since 2006, fueling recession fears

The next day, on March 29 and then again on April 1, the yield on 2-year U.S. treasury notes climbed above the yield on 10-year U.S. treasury notes — prompting more potential recession talk. A key reason why is that a yield inversion has preceded every U.S. recession since at least 1955.

However, here are some important insights from our just-published April Elliott Wave Financial Forecast, a monthly publication which provides analysis of major U.S. financial markets:

The lead time between past inverted curves and economic contractions is widely variable … and usually does not occur until after the curve un-inverts. Since stock prices lead the economy, it is more reliable to monitor equities to estimate when the onset of an economic contraction may occur.

Indeed, here’s some historical evidence of that from Robert Prechter’s landmark book, The Socionomic Theory of Finance, which says:

It is important to understand that socionomic causality does not predict that each stock market decline will produce an official recession as defined by the National Bureau of Economic Research; it predicts that stock market declines and advances will reliably lead rather than follow whatever official recessions and recoveries do occur.

So, keep an eye on the stock market’s Elliott wave pattern for a clue about what’s ahead for the economy.

If you’re new to Elliott wave analysis, or simply need a refresher on the topic, you are encouraged to read Frost & Prechter’s Wall Street classic, Elliott Wave Principle: Key to Market Behavior.

Here’s a quote from the book:

In the 1930s, Ralph Nelson Elliott discovered that stock market prices trend and reverse in recognizable patterns. The patterns he discerned are repetitive in form but not necessarily in time or amplitude. Elliott isolated five such patterns, or “waves,” that recur in market price data. He named, defined and illustrated these patterns and their variations. He then described how they link together to form larger versions of themselves, how they in turn link to form the same patterns of the next larger size, and so on, producing a structured progression. He called this phenomenon The Wave Principle.

You may be interested in knowing that you can read the entire online version of Elliott Wave Principle: Key to Market Behavior for free.

You can get that free access by joining Club EWI, the world’s largest Elliott wave educational community.

Club EWI membership is free and allows you complimentary access to a wealth of Elliott wave educational resources on investing and trading without any obligation.

Just follow the link to get started: Elliott Wave Principle: Key to Market Behavior — free and unlimited access.

This article was syndicated by Elliott Wave International and was originally published under the headline Here’s a More Reliable “Recession Indicator” Versus an Inverted Yield Curve. EWI is the world’s largest market forecasting firm. Its staff of full-time analysts led by Chartered Market Technician Robert Prechter provides 24-hour-a-day market analysis to institutional and private investors around the world.

Stock Market Financial Panic

Stock Market turn Down might be coming.

Why a Financial “Panic” May Be Just Around the Corner
Here’s why global investors should keep a close eye on “sight deposits”

By Elliott Wave International

Investors look to an array of indicators in hopes of determining what is next for the financial markets in which they are interested.

Some investors may focus entirely on “technical” indicators such as the Relative Strength Index (RSI), price levels of “support” or “resistance,” or say, advancing vs. declining issues, just to name a few. As you probably know, there are many more technical indicators.

Market participants also look at sentiment readings such as mutual fund cash levels, investors’ use of leverage, surveys and so on.

Yet, there’s at least one indicator that many global investors may overlook, and that’s the weekly change in “sight deposits” at the Swiss National Bank.

This chart and commentary from the September Global Market Perspective, an Elliott Wave International publication which offers coverage of 50+ worldwide financial markets, provide insight:

For the week ending August 6, commercial banks poured 1.2 billion francs into the Swiss National Bank, the largest weekly inflow since mid-June. The cash that banks park at the central bank are called “sight deposits,” and, together, the June and August data points represent the largest weekly inflows since the coronavirus panic in early 2020.

The previous spikes on the chart show why we keep such a close eye on sight deposits. Bank officials move cash into the SNB when fear swells, and they pull cash back out when complacency returns.

So, it does appear that fear is starting to develop among bankers.

As the September Global Market Perspective goes on to say:

With total sight deposits pushing to an all-time record of 713 billion francs last month, bank officials seem all too happy to park their money at the central bank. Perhaps they know something that the average meme stock investor doesn’t.

Elliott Wave International’s global analysts will continue to monitor sight deposits along with other indicators, plus, the Elliott wave structure of 50+ global financial markets.

Indeed, the September Global Market Perspective shows a chart with the Elliott wave patterns of two major global stock indexes. The chart’s headline is “The Alarm Bells Are Ringing.

If you need to brush up on your knowledge of Elliott wave patterns, or you are new to Elliott wave analysis, you are encouraged to read the Wall Street classic: Elliott Wave Principle: Key to Market Behavior, by Frost & Prechter.

Here’s a quote from the book:

In its broadest sense, the Wave Principle suggests the idea that the same law that shapes living creatures and galaxies is inherent in the spirit and activities of men en masse. Because the stock market is the most meticulously tabulated reflector of mass psychology in the world, its data produce an excellent recording of man’s social psychological states and trends. This record of the fluctuating self-evaluation of social man’s own productive enterprise makes manifest specific patterns of progress and regress. What the Wave Principle says is that mankind’s progress (of which the stock market is a popularly determined valuation) does not occur in a straight line, does not occur randomly, and does not occur cyclically. Rather, progress takes place in a “three steps forward, two steps back” fashion, a form that nature prefers.

If you’d like to read the entire online version of the book, you can do so by becoming a Club EWI member. Club EWI is the world’s largest Elliott wave educational community and is free to join. You are under no obligation as a Club EWI member. Yet, members do enjoy complimentary access to a wealth of useful Elliott wave resources on financial markets, investing and trading.

Join Club EWI and get free access to the book by following this link: Elliott Wave Principle: Key to Market Behavior.

This article was syndicated by Elliott Wave International and was originally published under the headline Why a Financial “Panic” May Be Just Around the Corner. EWI is the world’s largest market forecasting firm. Its staff of full-time analysts led by Chartered Market Technician Robert Prechter provides 24-hour-a-day market analysis to institutional and private investors around the world.

Wicked E-Wave

Why This Wave is Usually a Market Downturn’s Most Wicked
The progression of mass emotions in financial markets “tends to follow a similar path each time around”

By Elliott Wave International

The Wave Principle’s basic pattern includes five waves in the direction of the larger trend, followed by three corrective waves.

In a bull market, the pattern is five up, followed by three down. In a bear market, the pattern unfolds in reverse: the five waves trend downward and the correction trends upward.

Each of these waves sports its own characteristics.

As the Wall Street classic book, Elliott Wave Principle: Key to Market Behavior, by Frost & Prechter, says:

The personality of each wave in the Elliott sequence is an integral part of the reflection of the mass psychology it embodies. The progression of mass emotions from pessimism to optimism and back again tends to follow a similar path each time around.

For example, strong price advances on high volume typically happen during wave 3 in a bull market. Of course, in a bear market, the strong price action is downward.

Returning to Elliott Wave Principle:

Third waves usually generate the greatest volume and price movement and are most often the extended wave in a series.

Let’s review an instance of a third wave in a downturn from recent financial history.

Here’s a chart and commentary from Elliott Wave International’s Aug. 21, 2015 U.S. Short Term Update:

This week’s sharp decline is clearly a third wave. It sports a steep slope with strong downside breadth and volume.

During the next trading session (August 24, 2015), the Dow fell nearly 1,100 points at the open.

As you might imagine, it would be highly helpful to learn how to anticipate third waves so one can prepare.

Indeed, Elliott Wave International has just made the 1-hour course, The Wave Principle Applied, free through May 15 for free Club EWI members. Club EWI membership allows you to get Elliott wave insights on investing and trading, the economy and social trends that you will not find anywhere else.

The Wave Principle Applied normally sells for $99, so you are encouraged to take advantage of this limited-time offer to access the course for free.

As the Wall Street classic book, Elliott Wave Principle: Key to Market Behavior, by Frost & Prechter says:

Without Elliott, there appear to be an infinite number of possibilities for market action. What the Wave Principle provides is a means of first limiting the possibilities and then ordering the relative probabilities of possible future market paths. Elliott’s highly specific rules reduce the number of valid alternatives to a minimum.

Get started with The Wave Principle Applied.

This article was syndicated by Elliott Wave International and was originally published under the headline Why This Wave is Usually a Market Downturn’s Most Wicked. EWI is the world’s largest market forecasting firm. Its staff of full-time analysts led by Chartered Market Technician Robert Prechter provides 24-hour-a-day market analysis to institutional and private investors around the world.

Don’t Buy the Dips .. yet

Stocks: Why “Buying the Dip” is Fraught with Danger
Take a look at “a dip buyer’s nightmare”

By Elliott Wave International

Investors know that the main U.S. stock indexes have tumbled very quickly.

On a historical basis, some may not realize just how quickly.

A March 23 Marketwatch headline referred to a “mind-bending stat”:

The S&P 500 has dropped 30% from peak to trough faster than any other time in history. The next three fastest were all nasty pullbacks during the Great Depression era. Yes, just 22 days for this stock market to get cut by a third.

This historically swift downturn has prompted a “buy the dip” mentality.

On March 23, a prominent founder of a financial firm told CNBC:

“I’m nibbling right now, for what it is worth.”

Other professional investors have also mentioned that they were doing a little nibbling of their own.

The sentiment expressed was that the market may have a little more downside to go, but that’s about it.

These professionals might turn out to be correct in their judgments of the market. Then again, just because stocks have fallen far and fast – doesn’t mean they can’t fall way farther.

As a historical lesson, let’s take you back 19 years, when our April 2001 Elliott Wave Financial Forecast showed this chart and said:

“If there were ever a testament to the importance of market timing, the NASDAQ over the last year is it. Anyone who bought into the euphoria at the all-time high or the bull trap highs of early September and late January, would have taken successive hits of 40%, 47% and 38%. You can bet that many people followed the “buy” advice in the media on every bounce, losing even more than the “hold-only” loss of 65% from top to bottom.”

Bear in mind, the NASDAQ continued to fall into October 2002, handing even deeper losses to investors who continued to buy on the way down.

Returning to 2020, only time will tell when the bear market has bottomed, if it hasn’t already done so.

Yet, one thing’s for sure even now: The Elliott wave model is offering its own clues about what’s next for the main stock indexes.

See for yourself – 100% free.

You see, Elliott Wave International has just made available our entire “Stocks” section of our monthly Elliott Wave Financial Forecast to Club EWI members. Joining Club EWI is also free.

Elliott Wave International has been guiding investors through bull and bear markets since 1979. From that long experience, EWI’s analysts know that at certain market junctures, they can help the most by giving everyone their latest analysis free.

Now is one of those market junctures.

Read the Financial Forecast excerpt now, free.

This will help you understand how the markets got to this juncture — and, more importantly what’s likely next.

Also, please feel free to share this special excerpt with friends and family.

Again, simply follow this link:

Read the Financial Forecast excerpt now, free.

This article was syndicated by Elliott Wave International and was originally published under the headline Stocks: Why “Buying the Dip” is Fraught with Danger. EWI is the world’s largest market forecasting firm. Its staff of full-time analysts led by Chartered Market Technician Robert Prechter provides 24-hour-a-day market analysis to institutional and private investors around the world.

This article was syndicated by Elliott Wave International and was originally published under the headline Stocks: Why “Buying the Dip” is Fraught with Danger. EWI is the world’s largest market forecasting firm. Its staff of full-time analysts led by Chartered Market Technician Robert Prechter provides 24-hour-a-day market analysis to institutional and private investors around the world.
–>

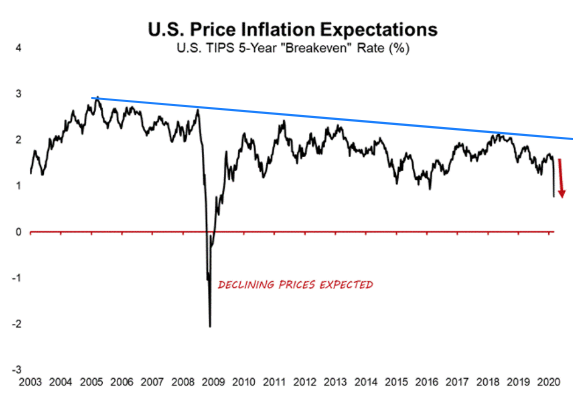
Deflation

Deflation has actually been in place for the past 15-years. (Blue line on graph below)

Slowly but surely, assets are becoming worth less.

Compare the current Market decline due to the Chinese Corona Virus with the recent Financial Market collapse of 2007-2009. We currently still have a ways to go Down if we are to match that collapse. (Red arrow)

My portfolio (including every account I have .. College Fund, Retirement Fund, short-term accounts) is:

  • 1/4 Down positions
    • Put options
    • Bearish Call Credit Option Spreads
    • Inverse Index ETFs
  • 3/4 Cash

GOLD for smart people

Gold: Learn from the Actions of the “Smartest on Wall Street”
Deep-pocketed speculators miss the big turns — but you don’t have to

By Elliott Wave International

Hedge fund managers are considered to be among the smartest people on Wall Street.

Ironically, as a group, they’re notorious for consistently being on the wrong side of major turns in the markets they trade. By contrast, a group of insiders called Commercials are generally on the right side of major market turns.

With that in mind, consider this commentary from the August 2015 Elliott Wave Financial Forecast, and note on the chart that hedge managers are synonymous with the term Large Speculators:

Large Speculators and Commercials hold a net-position size that is a multi-year extreme, and it is opposite to the position size held several weeks prior to gold’s all-time high at $1921.50 in September 2011 and at gold’s peak in October 2012 … a sentiment that is consistent with a gold rally. Despite the possibility of near-term base-building, we still anticipate that the advance, when it starts, will last several months.

Indeed, in December 2015, gold hit a low of $1046.20 and then rallied to $1375.53 on July 6, 2016, a 31% increase.

A reversal followed which sent the price of gold to a Dec. 15, 2016 low of $1122.98.

At that time, as you might have guessed, sentiment had again turned decidedly bearish.

Here’s a Dec. 29, 2016 Marketwatch headline:

2017 is the year gold drops below $1,000

Instead, however, gold started another climb. By Jan. 25, 2018, the price hit $1366.38, and the Daily Sentiment reading from trade-futures.com registered 91% bullish.

But, yet again, most big players were on the wrong side as gold began another slide.

By Aug. 16, 2018, gold hit a low of $1160.24. After the market closed on that date, our U.S. Short Term Update said:

Large Specs currently [hold] their second smallest net-long positions in 16 years at 3.5%.

In other words, 96.5% of deep-pocketed speculators were betting that gold’s price would continue to decline.

But, if you’ve been an observer of the gold market, you know that the price of gold has not looked back since then.

Instead of trend following, Elliott Wave International’s analysts use the Wave Principle to forecast the price behavior of widely traded markets, like gold.

The Elliott wave method not only helps traders to identify the main price trend, it also provides market participants with a high level of confidence in determining the maturity of a price trend.

Get important insights in the free report, “Learn How the Wave Principle Can Improve Your Trading.”

This article was syndicated by Elliott Wave International and was originally published under the headline Gold: Learn from the Actions of the “Smartest on Wall Street”. EWI is the world’s largest market forecasting firm. Its staff of full-time analysts led by Chartered Market Technician Robert Prechter provides 24-hour-a-day market analysis to institutional and private investors around the world.

Stock Market and the Fed

Elliott Wave: Fed Follows Market Yet Again

By Steve Hochberg and Pete Kendall

Back in December, we wrote an article titled “Interest Rates Win Again as Fed Follows Market.”

In the piece, we noted that while most experts believe that central banks set interest rates, it’s actually the other way around—the market leads, and the Fed follows.

We pointed out that the December rate hike followed increases in the six-month and three-month U.S. Treasury bill yields set by the market.

What happened with this week’s Fed announcement? Well, you guessed it—the Fed simply followed the market yet again.

The chart above is an updated version of the one we showed in our last article. The red line is the U.S. Federal Funds rate, the yellow line is the rate on the 3-month U.S. T-bill and the green line is the rate on the 6-month U.S. T-bill. The latter two rates are freely-traded in the auction arena, while the former rate is set by the Fed.

Now observe the grey ellipses. Throughout 2017-2018, the rates on 3-and-6-month U.S. T-bills were rising steadily, pushing above the Fed Fund’s rate. During the period shown on the graph, the Fed raised its interest rate six times, each time to keep up with the rising T-bill rates. The interest-rate market is the dog wagging the central-bank tail.

Now note what T-bill rates have been doing since November of last year; they’ve stopped rising. Rates have moved net-sideways, which was the market’s way of signaling that the Fed would not raise the Fed Funds rate this week.

Too many investors and pundits obsess over whether the Fed will raise or lower the Fed Funds rate and what it all supposedly means. First, if you want to know what the Fed will or will not do, simply look at T-bills, as shown on the chart. Second, whatever their action, it doesn’t matter because the Fed’s interest-rate policy cannot force people to borrow.

See Chapter 3 of The Socionomic Theory of Finance for more evidence.